Bitcoin futures (BTC1!) and Ether futures (ETH1!) are both in a “pause after the push” phase. The daily charts still reflect a rebound attempt that is stalling under overhead supply, while the 4H footprint view adds an important layer: the market is not panicking, it is rotating into balance and waiting for the next catalyst.
This is not financial advice. It is educational decision support based on price action and order flow style footprint behavior. But, first, the backdrop affecting crypto now. And, remember, everyone was watching the earnings of the biggest stock in the world last night (and wanted to see how this might affect ‘risk on’ or ‘risk off’ sentiment, that could trickle down to crypto as well).
The recent market volatility has been characterized by sharp technical corrections and equally swift recoveries, particularly as Bitcoin rips to $68,000 in a quick turnaround following a dip to the $62,500 level. This rebound is viewed by many as a signal that the broader risk trade remains intact, especially as some are already buying the contrarian dip in crypto to capitalize on what appears to be a flushing out of overleveraged positions rather than a fundamental breakdown. This resilience in digital assets is mirroring the tech sector, where Nvidia’s Huang says markets misjudge AI threat as revenue and guidance smash forecasts, providing a massive fundamental backstop to the AI and infrastructure narrative. However, the early market reaction shows that the bar for Nvidia may have gotten even higher, suggesting that “pricing for perfection” is now the baseline, leaving little room for error as geopolitical and trade uncertainties linger.
When you look at the raw data against this chaotic macroeconomic backdrop, it’s clear digital assets are sitting at a massive crossroads right now. Bitcoin CME Futures are currently hovering right around $68,185, pulling back a bit by 1.91%, or roughly $1,330, on the day. If you’re watching the charts today, the immediate range is pretty tight, you’ve got support holding near the daily low of $67,965 and resistance capping things off around the session high of $69,195.
But to really understand the technical setup, you have to zoom out. Sure, we’re seeing a spark of short-term momentum with a 3.11% pop over the last week, but that little victory is fighting against a brutal longer-term downtrend. We’re still down 23% year-to-date and nursing a painful nearly 40% drop over the last six months (!).
When you compare this recent weekly bounce to those heavy multi-month losses, especially considering we’re miles away from the 52-week high of $127,240, it becomes obvious just how critical these current price levels are. The big question now is whether this is just a fleeting relief rally, or the actual groundwork for a real, sustained reversal.
Ethereum’s 20% Surge Activates a Major Bull Flag — Now the Real Test Begins
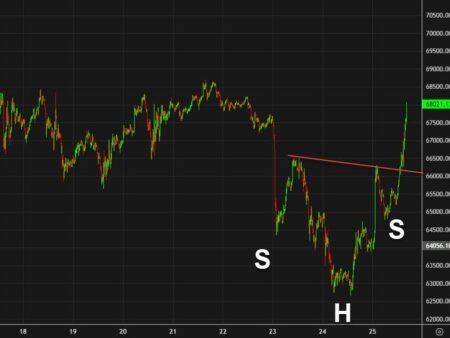
Ethereum is stealing the spotlight right now, officially outpacing Bitcoin yesteraday after an explosive rally that sent prices soaring roughly 20% since Thursday morning. Looking at the 1-hour Ether Futures chart, the technical setup is incredibly compelling: the price successfully broke out of its lengthy descending channel, decisively activating a textbook bull flag. Currently trading around the $2,061.0 mark following a minor intraday pullback, the mission for buyers is crystal clear. Bulls absolutely must step up and defend the upper boundary of this previously broken flag, turning former resistance into new support. If they can successfully hold this line, the bullish technical narrative remains completely intact, paving the way for the market’s next leg up. But bulls can not fully celebrate yet and I explain why below.
Ethereum 1h chart. Price broke out of the bull flag.
The daily view: rebound energy is fading into consolidation
Bitcoin futures daily: rebound, then hesitation
On the daily timeframe, BTC looks like it successfully defended a downside extension, then ran into supply and began to stall. That usually means one of two things:
-
The market is building a base to continue higher
-
The rebound was mostly short-covering and it will fade once buyers stop pressing
The key daily takeaway is simple: the bounce happened, but the market still needs proof that it can reclaim and hold higher prices rather than just tag them.
Ether futures daily: similar story, slightly weaker posture
ETH is in the same “rebound then pause” regime, but with a slightly more fragile feel because it is repeatedly reacting around a psychologically important area near $2,000. When a market hovers around a major round number after a rebound, it tends to behave like a magnet. It pulls price in both directions until one side finally wins acceptance.
Educational note: round numbers like $2,000 and $70,000 are not magic, but they attract liquidity. That liquidity can amplify fakeouts and fast moves.
The 4H footprint view: what the market is saying right now
When you zoom into the 4H footprint sequence, you can see the “story of effort vs result” more clearly.
BTC 4H: push, rejection, then low-delta chop
BTC printed a clean expansion higher, then got hit with a meaningful response sell bar. After that, the more recent bars show very small delta and smaller participation. That often means:
-
Sellers took a shot and did not immediately get follow-through
-
Buyers are not aggressively lifting offers either
-
The market is rotating into balance, not trending
Educational note: low delta during sideways price action is often a “wait state.” The next break can be sharp because liquidity builds up while participation looks quiet.
ETH 4H: rejection had more teeth, stabilization attempt follows
ETH also had the impulse higher, but its rejection bar looks more forceful and the stabilization is less convincing. The good news for bulls is that sell pressure appears to cool after the rejection. The challenge is that ETH still needs to reclaim overhead zones to prove that the rebound is turning into continuation.
Educational note: a strong rejection followed by shrinking negative delta is a common early stabilization pattern. It is not a reversal signal by itself. It is a “pressure is reducing” signal that still needs confirmation from price acceptance.
Key zones traders keep reacting to (why they matter)
You can think of these as “acceptance tests.” The market often wicks into them, but what matters is whether price can hold and build above or below them.
Crypto key evels to watch, investingLive.com, 26 Feb 2026
Bitcoin futures
-
Overhead supply zone: roughly $68,750-$69,000
-
First support area: roughly $67,750
-
Deeper support area: roughly $67,200-$66,700
Why it matters: BTC is currently doing business in a range where both sides are probing. Acceptance above the overhead supply zone shifts odds toward continuation. Acceptance below the deeper support zone shifts odds toward a fade of the rebound.
Ether futures
-
Overhead supply zone: roughly $2,075-$2,100
-
First support area: roughly $2,055-$2,045
-
Major psychological line: $2,000
Why it matters: $2,000 is a liquidity magnet. Markets often whip around these levels. A clean hold above the overhead zone improves the bull case. Sustained trade below $2,000 tends to change sentiment quickly because it signals that the rebound failed to stick.
What “sustained acceptance” actually means
A lot of traders get chopped up because they treat one wick as confirmation.
A more disciplined definition:
-
One spike through a level is a test
-
Multiple closes holding the level is acceptance
-
Acceptance plus follow-through is confirmation
This matters because both BTC and ETH are currently in conditions where fakeouts are common.
Practical takeaways for crypto traders and investors
For day traders
-
Expect chop until the market proves acceptance above or below the key zones.
-
In balance regimes, getting “married to direction” tends to be expensive.
-
Focus on reaction quality: does price hold above the reclaim, or snap back immediately?
For swing traders and investors
-
This is still a post-rebound digestion phase. That can resolve higher, or it can fade.
-
You want to see the market build value higher over time, not just print one strong rebound day.
-
If you are positioning longer-term, the best signal is usually not the first push, it is the ability to hold after the push.
Crypto followers should now stay patient and watch the key price levels
Daily says: the rebound is real, but it is stalling under supply.
4H says: BTC is stalling in balance, ETH is stalling with a slightly stronger rejection.
If 4H stays constructive while daily is still bearish: expect chop and sharp swings. That is often where traders get trapped. This is a stage that day traders should be disciplined with trailing stops, and considering to take partial profits fairly early.
In this environment, the highest value skill is patience: wait for price acceptance (see the price mentioned above), not just a momentary spike.