Prediction Score: +2 / +10
Primary bias right now: neutral to slightly bullish repair, but still inside a decision zone.
I would change that view if price close below the Value Area Low. What’s that? You will learn about that here.
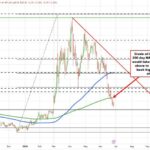
Looking only at this daily chart for NVDA, the biggest message from the two quarterly anchored volume profiles is that value migrated higher from one earnings quarter to the next, but price has not yet fully re-accepted that higher value.
NVDA daily chart with volume profiles from earnings
The older anchored profile appears to center around a POC near $182, with its broader value area roughly stretching from the mid-$173s up into the low-$193s. The newer anchored profile appears to center higher, around a POC near $188, with value roughly between $179 and $190-$191. That shift upward matters. It says the market, on a quarter-to-quarter basis, was willing to do more business at higher prices. Structurally, that is constructive.
But the current price action is the nuance.
NVDA is trading around $183.34, which puts it above the older quarter’s POC area, but below the newer quarter’s POC and below the upper part of the newer value area. In plain English, the stock is sitting between the old fair-value zone and the new fair-value zone. That usually means rotation and negotiation, not clean trend control.
What I find constructive is the recent reaction from the lower area. The selloff pushed down toward the $179 zone and briefly into the mid-$170s, then buyers stepped in and lifted price back. That tells me the lower edge of the newer quarter’s value area, plus the older quarter’s lower acceptance zone, still attracted demand. So this does not look like a clean bearish acceptance below value. It looks more like a failed downside auction attempt, at least for now.
Still, bulls have unfinished work.
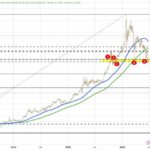
To shift this from “repair bounce” into something more bullish, NVDA needs to reclaim the newer quarter’s POC near $188, then show acceptance above the $190-$191 area. If that happens, the path opens toward the overlapping higher references around $193-$194, and then potentially back toward the upper swing area in the high-$190s.
On the bearish side, the key warning is simple. If this rebound stalls and price loses $182, then especially $179, that would suggest the bounce failed inside balance. In that case, the market likely rotates back toward the older lower acceptance area around $173-$174. A real acceptance below that zone would be much more damaging because it would mean both quarterly structures are losing support.
So, Value Area what…? How traders use anchored volume profile in technical analysis
Anchored volume profile is a way to measure where the market has done the most business from a specific starting point. Instead of looking at volume by time, it shows volume by price, which helps traders see where buyers and sellers were most active within a chosen period. The anchor point matters a lot. Many traders anchor the profile from an important event such as earnings, a major swing high or low, a breakout, or a sharp reversal. That turns the tool into a map of how the market has accepted or rejected price since that event.
One of the most important levels inside an anchored volume profile is the Point of Control, or POC. This is the price where the highest amount of volume traded during that anchored period. In simple terms, it often represents the market’s fairest price for that phase. Around it, traders also watch the value area, which is the zone where most of the volume was transacted. When price is trading inside that area, the market is often in balance. When price moves outside it, the market may be testing whether it can build acceptance at a new level.
This is where anchored volume profile becomes useful in real trading. If price is above the anchored POC and continues holding higher value, that can suggest improving demand and stronger bullish control. If price falls back below the POC after failing to hold higher levels, it may signal rejection and a return to prior balance. In other words, the tool helps traders judge whether a move is being accepted or whether it is likely to fade.
Another strength of anchored volume profile is context. A moving average can show trend, but it does not show where the market actually agreed on price. Anchored volume profile does. That is why many traders combine it with price action, candlestick structure, and support or resistance. If several important references line up near the same area, that price zone often becomes more important.
Used well, anchored volume profile is not about predicting the future with certainty. It is about improving market location. It helps traders identify where value sits now, where value used to sit, and whether price is moving into acceptance, rejection, or a potential transition between the two.
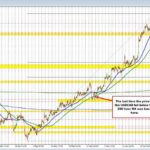
Back to my NVDA daily chart with those volume profiles
So the chart is not saying “strong bullish continuation” yet, but it is also not confirming a fresh bearish breakdown. It is saying:
Quarter-over-quarter structure is still constructive, but near-term price is trapped in a re-acceptance test.
Key levels I would respect:
-
$182-$183: older quarter POC / immediate pivot
-
$179: newer quarter lower value support
-
$188: newer quarter POC
-
$190-$191: higher value acceptance trigger
-
$193-$194: next upside rotation zone
-
$173-$174: deeper support / failure zone
My bottom line: this looks more like a market trying to repair after a downside flush, not a clean trend leg yet. The chart becomes meaningfully stronger only if NVDA can hold above $182-$183 and reclaim $188-$191. Until then, expect chop and two-sided trade inside overlapping quarterly value. I’m deliberately framing this as scenario-based decision support rather than a certainty call. Last but not least, what may working for the bulls is the latest earnings from NVDA peer, MRVL, which was up apx 15% after its recent earnings. Stay tuned for more at investingLive.com