Understanding the charts and patterns to make informed decisions.
Introduction
Markets today are characterized by volatility and rapid fluctuations, making it essential for investors and traders to adopt effective strategies for analysis and decision-making. Technical analysis offers tools to interpret price movements and forecast future trends, helping market participants navigate the complexities of trading.
What is Technical Analysis?
Technical analysis involves evaluating securities by analyzing statistics generated by market activity, such as price movement and volume. Unlike fundamental analysis, which examines a company’s financial health, technical analysis focuses on historical price patterns to predict future movements.
Key Components of Technical Analysis
1. Charts
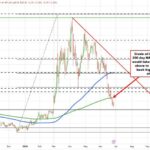
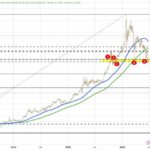
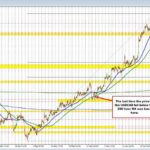
Charts provide a visual representation of price movements over time. Line charts, bar charts, and candlestick charts are commonly used to identify trends and reversals.
2. Indicators
Indicators are mathematical calculations based on price and volume. Common indicators include the Moving Average, Relative Strength Index (RSI), and Bollinger Bands, which help traders identify bullish or bearish conditions.
3. Patterns
Chart patterns, such as head and shoulders, triangles, and flags, can signal potential market reversals or continuations. Recognizing these patterns can assist traders in making timely decisions.
Current Market Conditions
Today’s market is influenced by various factors including economic data, geopolitical events, and sentiment changes. Technical analysis helps in understanding these fluctuations and establishing entry and exit points in trading strategies.
Applying Technical Analysis in Today’s Markets
While no method guarantees success, combining technical analysis with risk management strategies can significantly enhance trading performance. Traders should remain flexible, adapting their strategies as market conditions evolve.
Conclusion
In a rapidly changing market environment, technical analysis serves as a valuable tool for traders and investors. By focusing on price movements and historical patterns, market participants can navigate fluctuations with greater confidence and make informed decisions.