Prediction Score: -3 / +10
Current bias: Mildly bearish while Nasdaq futures remain below the $29,300 to $29,321.50 resistance cluster
Key tradeCompass level for today: $29,313
Bullish activation level: $29,427
Key takeaways for Nasdaq futures traders today
- Nasdaq futures remain mildly bearish below $29,313, which sits inside a tight resistance cluster made up of prior POC and VWAP references.
- The bearish setup is already active while NQ trades below the $29,300 to $29,321.50 zone.
- The first bearish profit target is $29,222, followed by $29,136, $29,078, $28,829, and $28,575 if sellers extend control.
- Bulls need sustained acceptance above $29,427 to shift the tradeCompass map from bearish to bullish.
- This is still a range-market environment, not a confirmed breakdown trend, so traders should manage risk carefully and avoid overtrading the middle of the range.
Nasdaq futures analysis today: Why $29,313 matters
Nasdaq futures are trading below a key resistance cluster, keeping the short-term tradeCompass bias mildly bearish. The most important level for today’s Nasdaq futures analysis is $29,313, which acts as the single-line decision point for traders who do not want to manage the full zone.
That $29,313 area is important because it sits inside a tight technical cluster:
| Level | Source | Why it matters |
|---|---|---|
| $29,300 | May 17 point of control | Prior volume acceptance area |
| $29,313 | May 16 VWAP | Single tradeCompass decision level |
| $29,321.50 | Yesterday’s point of control | Recent fair value reference |
This cluster matters because markets often react around areas where multiple technical references overlap. When price trades below a prior POC and VWAP cluster, it suggests that buyers have not yet accepted higher value. That does not guarantee a sell-off, but it gives bears the tactical advantage until price proves otherwise.
For today, as long as NQ remains below $29,313, the bearish side has the upper hand.
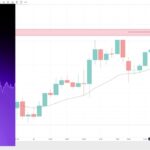
NASDAQ Futures Face Resistance: Navigating the Hourly Pullback
NQ hourly chart with 20EMA indicator. Keep it simple.
When I look at the hourly charts for NASDAQ 100 E-mini Futures (NQ1!), the first thing that stands out is the recent upward push that ran right into a distinct overhead resistance zone. You can see this highlighted by the red band near the 29,450–29,500 level. After testing this ceiling, the price faced clear rejection, bringing us into the active pullback phase we are seeing right now around the 29,227 level.
The Educational Takeaway For Traders
One thing that I like to give away about the EMA20 on the hourly chart—which is currently sitting at 29,271—is how effectively it acts as a dynamic gauge for short-term momentum.
Here is how I look at it:
-
Dynamic Support and Resistance: Unlike static horizontal lines, the 20-period Exponential Moving Average adjusts with recent price action, keeping you tuned in to the most current data.
-
Gauging the Trend: When prices are consistently riding above the EMA20, the short-term trend is firmly in control of the buyers. When price slips below it, as it just did, it signals potential weakness.
-
What to Watch Next: With the price now sitting just below that 29,271 level, the key question is whether this is just a temporary dip before buyers step back in to reclaim the moving average, or if this break signals a deeper correction.
Always remember to pair moving averages with key resistance zones, like the one shown above, to build a stronger, high-probability trading thesis
What does the -3 / +10 Nasdaq futures score mean?
The current Prediction Score of -3 / +10 reflects a mildly bearish outlook, not an aggressive short signal.
On the investingLive tradeCompass scale, negative scores favor bearish conditions, positive scores favor bullish conditions, and scores near zero suggest uncertainty or range behavior. A -3 means sellers have an edge, but the market has not yet produced the kind of confirmation that would justify calling this a high-conviction bearish trend.
In practical terms, the score says:
- Bears have the current tactical edge.
- Price is below an important resistance cluster.
- The market is still range-bound.
- Downside targets are valid, but traders should avoid assuming a straight-line move lower.
This is why risk management and partial profit-taking matter. A mildly bearish score can work well for tactical trades, but it can also be vulnerable to sharp reversals if price reclaims the decision zone.
Nasdaq futures bearish below $29,313
The bearish tradeCompass setup is active below $29,313.
This does not mean traders should blindly short every tick below that level. It means the market structure favors the bearish side while price remains under the prior POC and VWAP cluster.
A cleaner bearish scenario would include one or more of the following:
- Failed rally into $29,300 to $29,321.50
- Price rejection from around $29,313
- Sellers defending the cluster after a retest
- Weak recovery attempts that fail to reclaim prior value
- Acceleration toward $29,222
The key educational point is that prior POC and VWAP zones often behave like value memory. If price cannot reclaim them, traders may interpret that as a sign that the market is rejecting higher value and rotating lower.
Bearish partial profit targets for NQ futures
If Nasdaq futures remain below $29,313, bearish traders can map the following downside levels:
| Bearish target | Level | Interpretation |
|---|---|---|
| TP1 | $29,222 | Just above today’s POC and May 18 value area high |
| TP2 | $29,136 | Next downside target if sellers maintain pressure |
| TP3 | $29,078 | Near May 17 VWAP and May 19 value area high |
| TP4 | $28,829 | Just above May 19 value area low |
| Runner | $28,575 | Deeper downside target if the range weakens further |
The first bearish target at $29,222 is the most realistic near-term objective in a range market. The deeper targets require stronger selling pressure, broader risk-off participation, or a clearer breakdown from the current range.
A practical trade management approach:
- Consider reducing risk after TP1.
- After TP1, and certainly after TP2, consider moving the stop to entry or tightening risk.
- Do not let a trade that reaches the first or second target turn into a full loss.
- Treat deeper targets as conditional, not guaranteed.
Nasdaq futures bullish above $29,427
The bullish scenario improves only if Nasdaq futures accept above $29,427.
That level is not the current base case, but it is important because it gives traders a clear invalidation point for the bearish map. If price reclaims $29,427 and holds above it, the market would start showing that buyers are regaining control rather than only producing a short-lived bounce.
For the bullish case to become more credible, traders would want to see:
- A sustained move above $29,427
- Price holding above that level after a retest
- Rejection of lower prices after reclaiming the zone
- Stronger participation from major tech names
- Reduced risk of another failed rally inside the range
The key phrase is sustained acceptance. A fast spike above $29,427 followed by a reversal back below it would not be enough. Traders should be cautious around fakeouts, especially in Nasdaq futures, where liquidity grabs around obvious levels are common.
Bullish partial profit targets for NQ futures
If NQ sustains trade above $29,427, the bullish tradeCompass path opens toward:
| Bullish target | Level | Interpretation |
|---|---|---|
| TP1 | $29,486 | First upside objective after bullish activation |
| TP2 | $29,588 | Next resistance area if buyers extend control |
| TP3 | $29,739 | Upper range target and logical profit-taking zone |
| Runner | $30,000 | Broader round-number magnet if momentum expands |
At $29,739, many traders may reasonably reduce or exit most of the position. That area is close to the broader upper-range region and should not be treated casually.
For those holding a runner, the $30,000 round number may become a psychological magnet. But it should be managed with a trailing stop, not treated as a guaranteed destination.
What is the broader Nasdaq futures range?
The broader Nasdaq futures structure still looks range-bound.
Since roughly May 12, NQ has mostly traded between the upper region near $29,750 and lower support behavior closer to the $28,750 area. That context matters because range markets often rotate from one side of value to the other before producing a confirmed breakout or breakdown.
In a range market:
- Breakouts often fail.
- Breakdowns can reverse quickly.
- Middle-zone trades can be low quality.
- Taking partial profits is often better than waiting for a perfect trend.
- Acceptance matters more than a single price touch.
This is why today’s tradeCompass map does not assume a full upside breakout or a major collapse. The current read is more tactical: bearish below $29,313, bullish only above $29,427, and cautious inside the middle.
Educational note: What is POC and why does it matter?
POC, or point of control, is the price level where the most volume traded during a selected period. Many traders use it as a reference for fair value because it shows where the market previously accepted the most activity.
When price is below a prior POC, that old fair value area can act as resistance. When price is above it, the same level can act as support.
For today’s Nasdaq futures map, the important point is that multiple POC and VWAP references are clustered around $29,300 to $29,321.50. That makes the zone more meaningful than a single isolated level.
Educational note: What is VWAP and why do traders watch it?
VWAP, or volume-weighted average price, measures the average price traded during a period, weighted by volume. It is widely watched by institutional traders because it helps define whether price is trading above or below a volume-adjusted fair value reference.
When price is below VWAP or below a prior VWAP cluster, it can signal that sellers are controlling the session or that buyers have not yet accepted higher prices.
In today’s case, the May 16 VWAP near $29,313 is especially important because it overlaps with prior POC references. That confluence strengthens the importance of the zone.
NVIDIA, tech sentiment, and today’s NQ market tone
The broader tech backdrop is not giving Nasdaq futures a clean bullish impulse. NVIDIA’s post-earnings reaction has not delivered the kind of decisive upside catalyst that would automatically force a bullish reassessment of NQ.
That matters because NVIDIA remains one of the most important sentiment drivers for large-cap tech and Nasdaq futures. When a major tech leader fails to produce a strong one-way reaction after earnings, traders often become more selective rather than aggressively risk-on.
The after-hours tone also supports this mixed message. Intel showed strength during the regular session, but then gave back part of that move after hours. That reinforces the idea that the market is not in panic mode, but rallies are not being strongly sustained either.
So the current Nasdaq futures tone is best described as a tactical tug-of-war, with bears holding the near-term edge while price remains below the $29,300 to $29,321.50 resistance cluster.
Practical tradeCompass map for Nasdaq futures today
| Zone or level | Bias | Trader interpretation |
|---|---|---|
| Below $29,313 | Bearish | Bears hold the tactical edge below the POC and VWAP cluster |
| $29,300 to $29,321.50 | Decision cluster | Prior POC and VWAP resistance area |
| Above $29,427 | Bullish | Buyers start to regain control if acceptance is sustained |
| $29,222 | Bearish TP1 | Near today’s POC and May 18 VAH |
| $29,136 | Bearish TP2 | Next downside target if selling continues |
| $29,078 | Bearish TP3 | Near May 17 VWAP and May 19 VAH |
| $28,829 | Bearish TP4 | Above May 19 VAL |
| $28,575 | Bearish runner | Deeper downside target if range support weakens |
| $29,486 | Bullish TP1 | First upside target above $29,427 |
| $29,588 | Bullish TP2 | Secondary bullish target |
| $29,739 | Bullish TP3 | Upper-range profit-taking zone |
How should traders use today’s Nasdaq futures tradeCompass?
Traders can use today’s Nasdaq futures tradeCompass as a decision map, not as a prediction guarantee.
The simplest version is:
- Bearish below $29,313
- Bullish above $29,427
- Caution between those zones
The bearish side is already active below $29,313, but the market is still range-bound. That means traders should be selective, avoid overtrading the middle, and respect the possibility of sharp intraday reversals.
A sustained move matters more than a quick crossover. Some traders may require a 15-minute hold beyond a level, while others may wait for a candle close on their preferred timeframe. The key is to avoid reacting to the first touch or first pierce of a level without confirmation.
Risk management reminder for NQ futures traders
Nasdaq futures can move quickly, especially around major technical levels and during periods of changing tech sentiment. That makes position sizing, stop placement, and partial profit-taking essential.
A disciplined trader should define in advance:
- Entry trigger
- Invalidation level
- First profit target
- Risk per contract
- Whether the plan is bearish or bullish
- When to move the stop to entry
- What would invalidate the original trade idea
The most dangerous area is often the middle of the map, where price is neither confirming bearish continuation nor bullish reversal. For today, that means traders should be especially cautious if NQ chops between $29,313 and $29,427.
Today’s summary for Nasdaq futures traders
Nasdaq futures remain mildly bearish according to today’s tradeCompass map. The key level is $29,313, which sits inside the important $29,300 to $29,321.50 resistance cluster built from prior POC and VWAP references.
As long as NQ stays below that area, bears retain the tactical advantage, with $29,222 as the first downside target. A sustained move above $29,427 would shift the map toward a bullish scenario, opening the path toward $29,486, $29,588, and $29,739.
This is still a range-driven market, so traders should avoid assuming either a full breakdown or a full upside breakout too early. The better approach is to respect the active bearish bias below $29,313, wait for confirmation around key levels, take partial profits when available, and manage risk aggressively.
Trade Nasdaq futures at your own risk. This analysis is for educational purposes only and is not financial advice.
FAQ for Nasdaq Traders Today
What is the key Nasdaq futures level to watch today?
The key Nasdaq futures level to watch today is $29,313, which sits inside a tight resistance cluster made up of prior POC and VWAP references.
Is the Nasdaq futures bias bullish or bearish today?
The current Nasdaq futures bias is mildly bearish below $29,313, with a Prediction Score of -3 / +10.
What level would turn Nasdaq futures bullish today?
Nasdaq futures would turn more bullish if NQ sustains acceptance above $29,427.
What are the downside targets for Nasdaq futures today?
The main downside targets are $29,222, $29,136, $29,078, $28,829, and $28,575, depending on whether sellers maintain control.