The GBPUSD remains under pressure after last week’s sharp political-driven selloff sent the pair tumbling nearly 350 pips from the 1.3652 high to the low near 1.3300 reached yesterday. Although buyers attempted a rebound, the recovery stalled at key technical resistance levels, allowing sellers to regain control and push the pair back toward the lows.
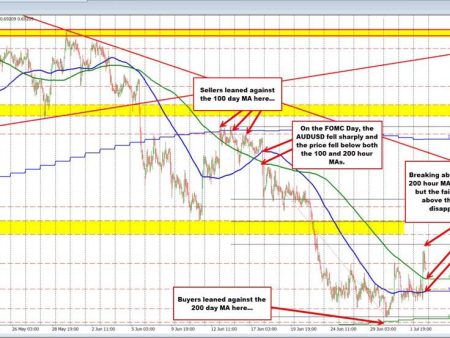
Technically, the battle is now centered around a cluster of major moving averages and retracement levels that are defining the short-term bias. Yesterday’s rebound pushed briefly above the 200-day moving average at 1.34229 currently and the falling 100-hour moving average (currently near 1.34154- but was higher yesterday), but buyers could not sustain momentum. The rally stalled within a key swing area between 1.34336 and 1.34667, with the high reaching 1.34488 before rotating sharply lower. That failure kept sellers in control.
Today, traders once again leaned against the falling 100-hour moving average during both the Asian and North American sessions. The repeated rejection against the 100-hour MA and nearby 200-day MA reinforced those levels as critical resistance “borderlines” for the pair. As long as the price remains below that moving average cluster, sellers maintain the technical advantage.
The weaker risk tone in broader markets is also helping the USD. US yields have moved back higher, with the 10-year Treasury yield rising to 4.683% after trading lower earlier in the session. Meanwhile, US equities are under pressure, with the Nasdaq down roughly -1.24% and the S&P index lower by around -0.75%. Those risk-off flows are helping support the dollar and weighing further on GBPUSD.
Technically, the next key downside target comes in at the 61.8% retracement of the move higher from the late-March low, which sits near 1.3350. That level is now a major support target for sellers. A move below it would increase bearish momentum and likely lead traders to target yesterday’s low at 1.3303. Break below that level, and the bearish trend would strengthen further.
On the topside, buyers need to reclaim several important resistance levels to regain control:
- 1.3408 – 50% midpoint of the rally from the March low
- 1.34154 – Falling 100-hour moving average
- 1.34229 – 200-day moving average
- 1.34336–1.34667 – Key swing area resistance zone
- 1.34488 – Yesterday’s rebound high
As long as the pair stays below the 100-hour and 200-day moving averages, rallies are likely to continue attracting sellers. Buyers need a sustained move back above that resistance cluster to shift momentum back in their favor. Until then, the technical bias remains tilted to the downside.